For many, December represents a convenient time to make New Year’s prognostications and resolutions. For the Federal Open Market Committee (FOMC) of the US Federal Reserve, December presents an opportunity to proffer both. FOMC members submit their forecasts on how the US economy will evolve, and what policy actions the FOMC will enact, during the following year. The Fed then publishes these forecasts in its so-called “dot plot,” a scatter plot of its estimates for the end-of-year readings of US economic variables (e.g., real GDP and inflation) as well as the Fed’s primary policy variable—the fed funds rate.1
Comparing Fed vs. market expectations
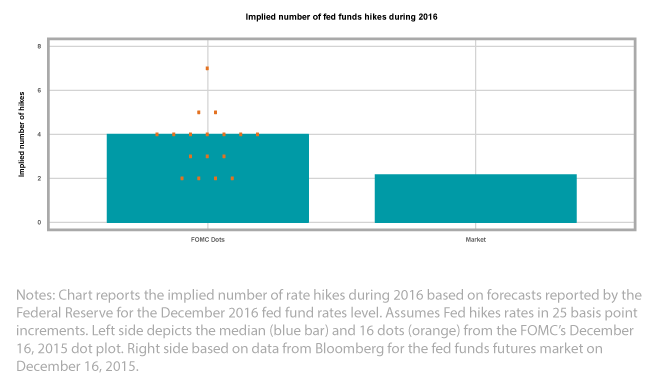
Since the Fed publishes its dot plot four times annually, perhaps a more accurate statement would describe December (and January) as a convenient time to evaluate the FOMC’s prognostications and resolutions. One dimension worth evaluating is the alignment of the Fed’s expectations of the future with the market’s. Along that dimension, the market seems to treat the FOMC’s dots more like a toddler’s random paint splattering than a precise, pointillist masterpiece by Seurat. According to the FOMC’s most recently released dot plot (December 16, 2015), the FOMC plans between two and seven rate hikes during 2016 with a median forecast of four.2 The fed funds futures market expects only two hikes (see chart below).

Something has to give. Either the Fed’s beginning-of-year intentions will prove more hawkish than its actions, or the market will need to adjust its expectations, or both. If the market must correct its expectations quickly, as it did during the summer of 2013 following comments from then-FOMC chairman Ben Bernanke about the end of quantitative easing, a market “tantrum” may ensue.


