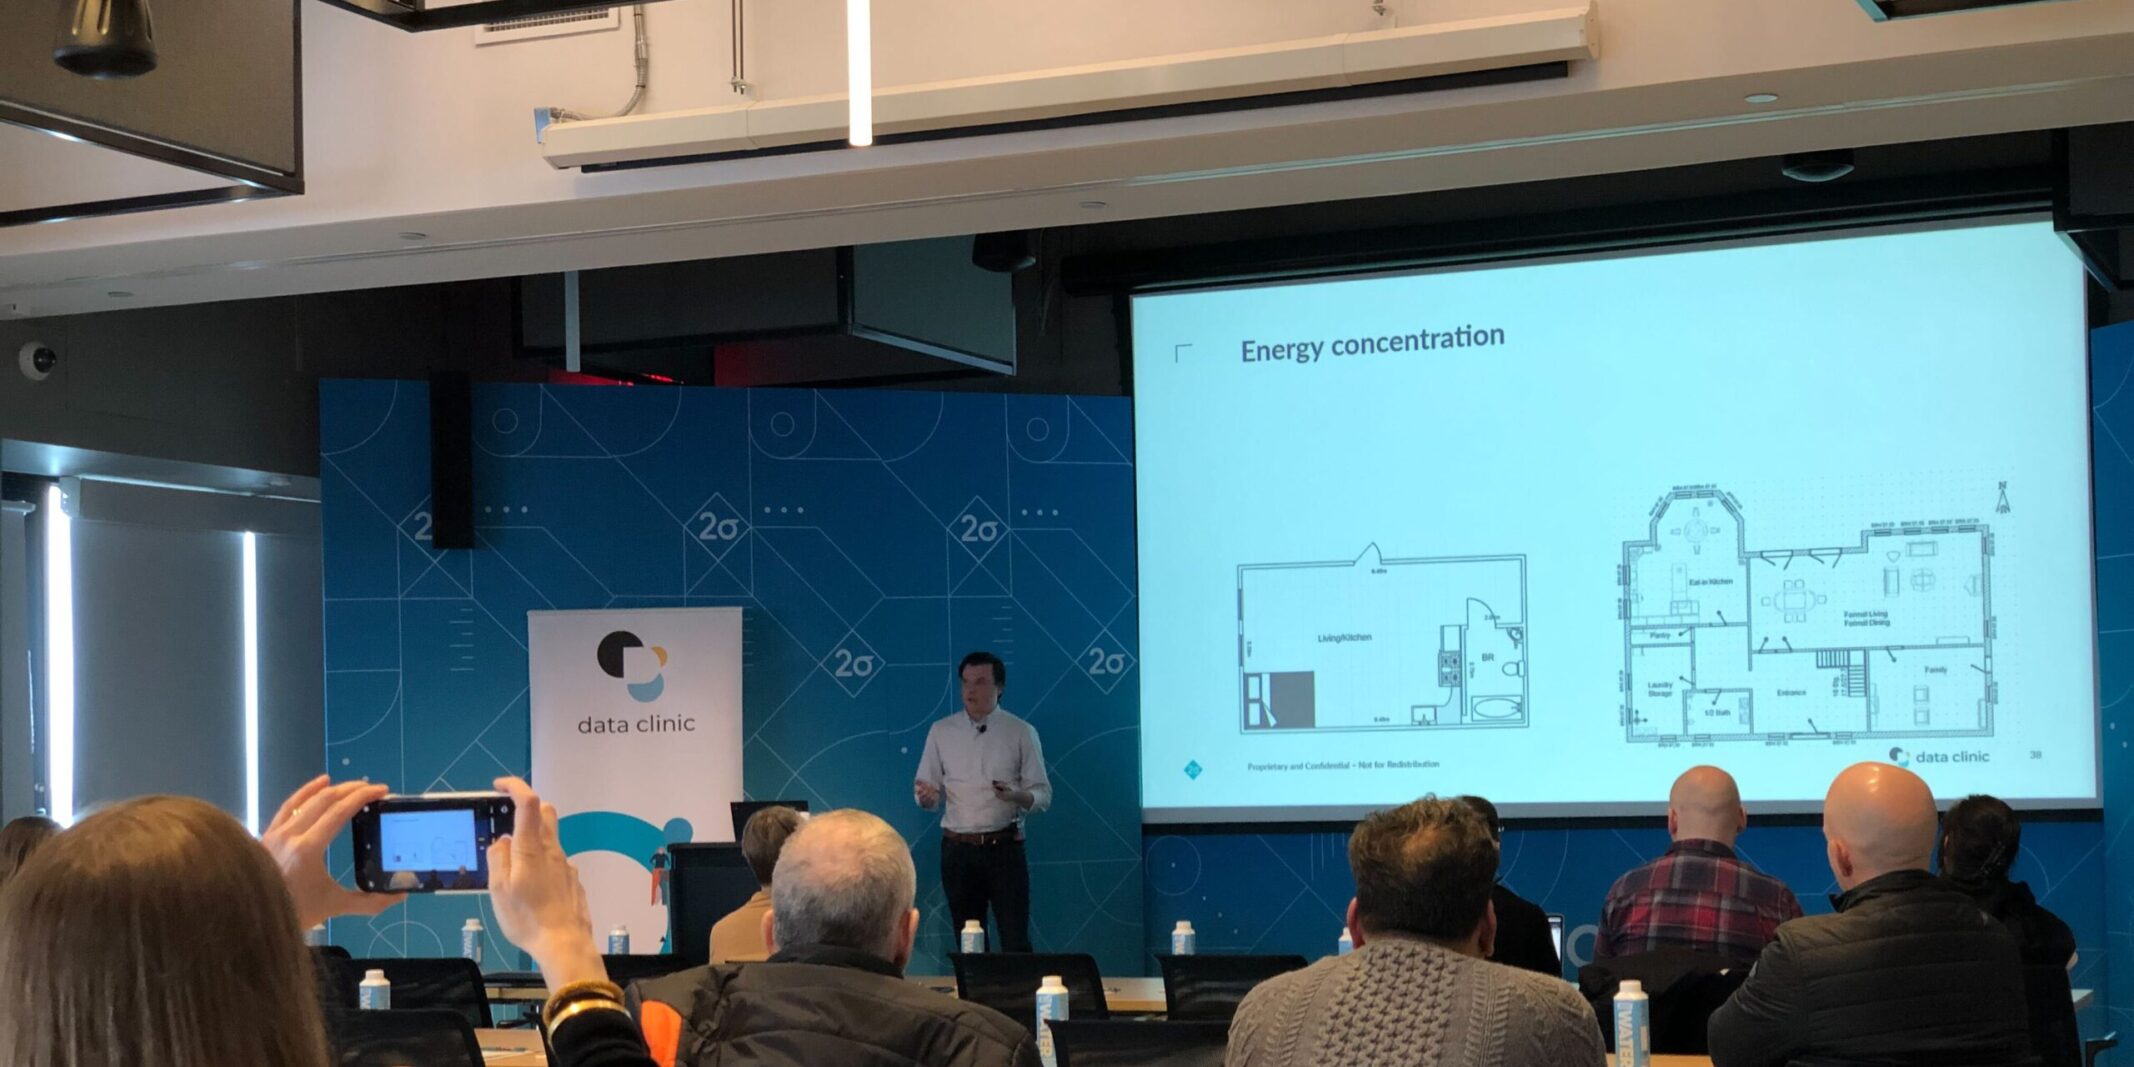
It’s no secret that Data Clinic is a big believer in open data. We’ve built Scout, an open source tool that helps users sort through open data portals, and we’ve leveraged these data sources in quite a few projects. We’re also fans of New York City’s annual Open Data Week—we have presented every year since 2017. This year, Data Clinic hosted a talk called Decoding Greenhouse Gas Emissions from NYC’s Residential Buildings at our office in Soho.
Background
About 70% of New York City’s greenhouse gas emissions result from operating (e.g., heating, cooling, electricity consumption) the city’s buildings. Recognizing this, the city government has made reducing building emissions a central tenet of NYC’s climate policy. That means tracking operational emissions (i.e., metered electricity consumption and how much oil goes in your boiler) for all the large buildings in the city—and setting limits on these emissions with fines and penalties.
Our talk focused on this energy consumption data to answer the question of why some multifamily residential buildings (the largest source of covered building emissions) are responsible for more greenhouse gas emissions than others. Specifically, we examined the emissions intensity metric, which measures the quantity of CO2 equivalent emitted per square foot of building floor area. This metric allows for comparisons across buildings of varying sizes. It is also used by Local Law 97 to set emissions limits and the corresponding fines for exceedances.
We explored several aspects of this topic, including how these emissions are measured and defined, how different building characteristics relate to emissions, and the potentially unexpected consequences of the per-square-foot measure. The complete talk can be viewed below:
Open Data Week 2024: Decoding Greenhouse Gas Emissions from NYC’s Residential Buildings
Highlights
For those short on time, we’ve summarized a few key points below.
Heating method matters
If you had to choose a single factor to explain why some buildings have more emissions per-square-foot than others, it would be hard to beat the building’s heating method. The differences are stark: over 80% of buildings heated with electricity are among the city’s most efficient, while the majority of buildings heated with fuel oil are in the least efficient bucket.
Two factors explain why heating is so important:
- Heating is the largest source of energy consumption for most residential buildings. Accordingly, differences in heating methods have a large effect on overall emissions.
- There is a big gap between the most and the least efficient heating methods – burning fuel oil in a boiler or furnace releases far more emissions than using grid electricity.

These differences have led to heating-related retrofits (e.g., heating electrification, replacing inefficient boilers) becoming a crucial strategy for buildings to reduce their emissions.
Smaller apartments have higher emissions intensity
A more surprising finding is that the size of a building’s apartments is strongly correlated with the building’s emissions intensity. Remember: emissions intensity measures the emission per square foot – not the total emissions associated with an apartment. Buildings with small apartments tend to have high emissions per square foot but low total emissions per apartment. Conversely, buildings with large apartments display the opposite pattern: low emissions intensity but high total emissions per apartment.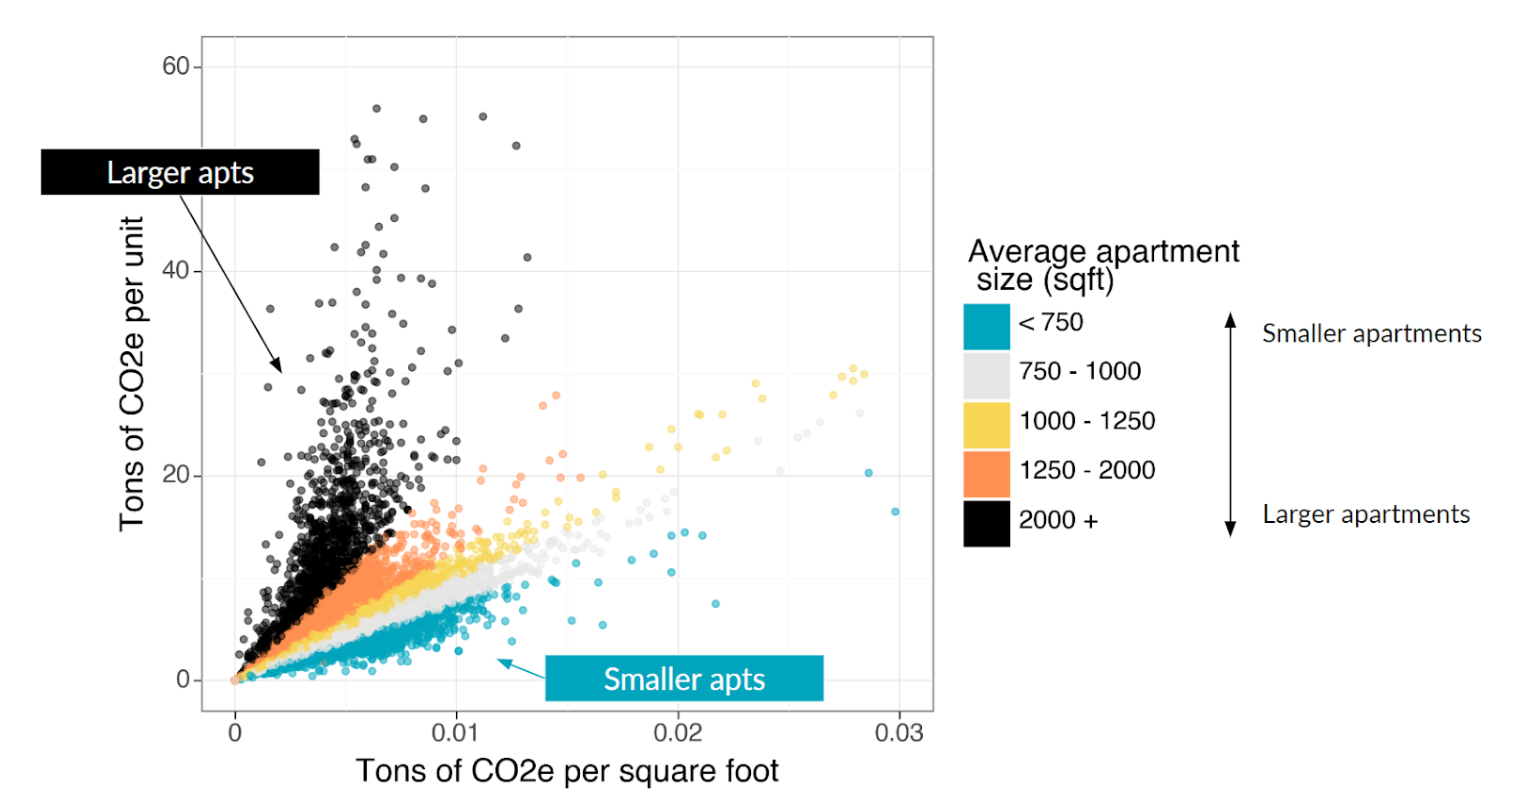
Buildings with smaller apartments have less space to heat and cool for each unit so the lower total emissions per-apartment is easy to explain.
But why would small apartments have higher emissions intensity? Buildings with small units could be less efficient (e.g., they might have poor insulation, older boilers, or more energy-intensive appliances) than those with larger units. Unfortunately, the available data make it difficult to quantify this effect.
However, we propose an alternative factor that we believe contributes to this relationship: energy concentration.
Energy concentration increases emissions intensity
Certain types of energy consumption, such as heating and cooling, scale with the size of the living space. For instance, heating a 2000 square foot apartment typically requires approximately twice as much energy as heating a 1000 square foot apartment – holding all else constant – because the total volume of space is twice as large. This is reflected in the higher total emissions per apartment. But since emissions intensity normalizes emissions by square footage, these sources of energy consumption are unlikely to account for the difference between buildings with large apartments and those with small ones.
Energy consumed for activities like cooking, heating water for bathing/cleaning, and using appliances doesn’t scale in quite the same way. Energy demand for these activities tend to remain constant or increase only slightly in larger living spaces. For example, a person living in a 2000 square foot apartment probably doesn’t take twice as many showers as someone in a smaller unit. As a result, the energy consumed by these activities is more concentrated in a smaller apartment, leading to a higher emissions per square foot.
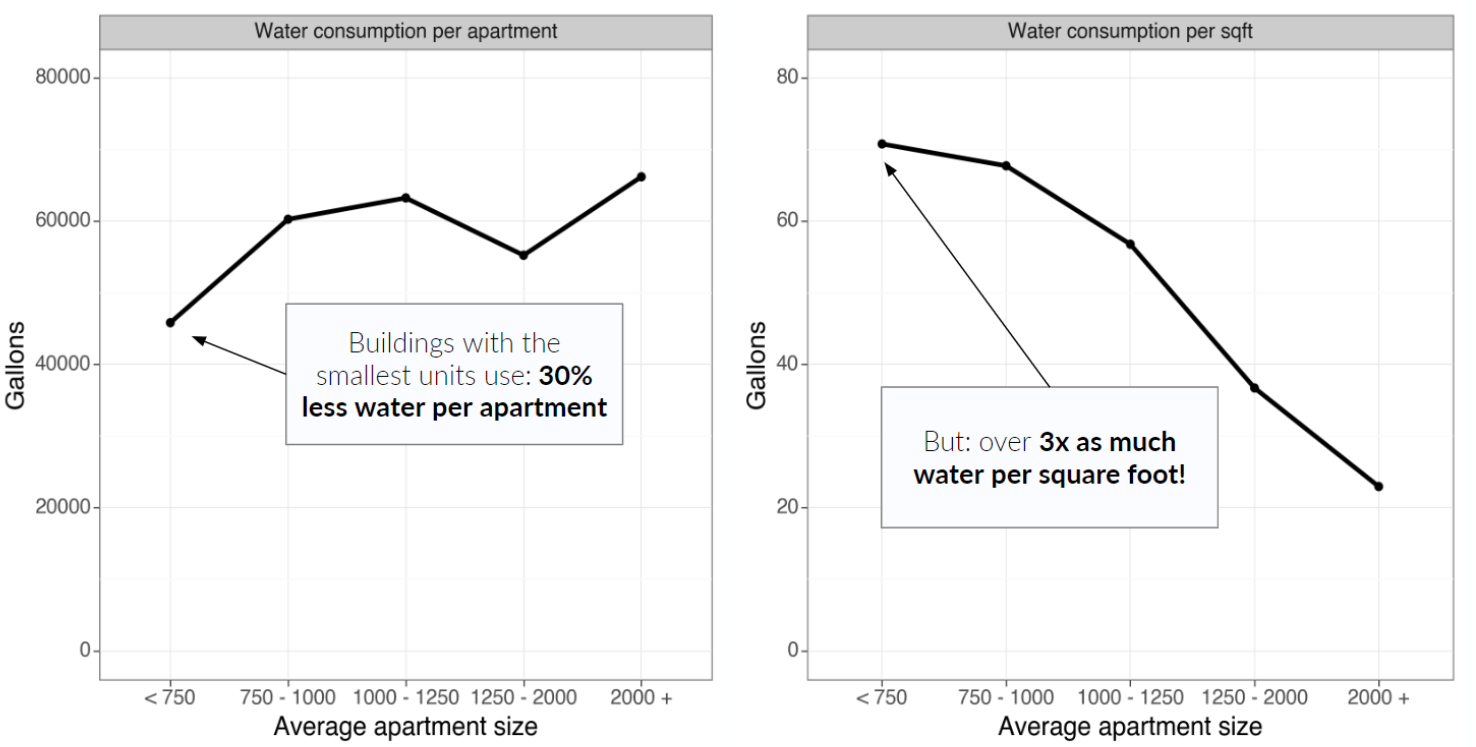
We can see this effect clearly in the case of water consumption. Buildings with the smallest units use a little less water per-apartment than buildings with big units, a difference of about 30%. However, buildings with small apartments use over 3 times more water on a per-square-foot basis. In a smaller space, the lower water consumption per apartment is more concentrated, meaning higher water consumption per square foot.
This energy concentration effect has received little attention so far. However, as building emissions in NYC and elsewhere become a focal point in the coming years, it’s crucial to consider the implications of using the per-square-foot emissions intensity metric when comparing residential buildings of different sizes.
Additional materials
These are only the highlights – there’s lots more covered in the full talk. The code behind this analysis is available on our GitHub. Additionally, a copy of the presentation slides are available here. You can also check out our previous blog post on the EnergyStar scores posted on NYC’s buildings.