This past summer, the Vera Institute of Justice partnered with the police departments of Tucson, Arizona, and Camden, New Jersey to help analyze their internal 911 data. From the Computer-Aided Dispatch (CAD) records that are typically generated from either a 911 caller requesting assistance or an officer-initiated action, Vera produced a variety of metrics related to the characteristics of these calls to help shape the conversation around alternative policing strategies and policy.
While each city’s data is valuable in isolation, Vera also wanted to situate it within the broader national context, which proved to be a challenge as no national aggregated dataset of 911 calls currently exists, nor even a national standard for collecting and reporting such data.
The proportion of calls arising from a public 911 request versus those that are officer-initiated will vary from city to city. Officer-initiated actions such as pedestrian or traffic stops are still processed through the CAD system and involve an officer notifying dispatch of their action. In contrast, for a public 911 call, a call-taker receives the call and a dispatcher deploys law enforcement resources.
The reason for these reports, both public and officer-initiated, can range from minor traffic incidents to more significant events such as burglary. However, according to research conducted by Vera’s policing program, the vast majority of 911 calls dispatching police are non-emergency. By exploring 911 data, key stakeholders can better understand the landscape of 911 calls that may be an unnecessary drain on law enforcement and could be better suited with alternative forms of response.
Wanting to keep their resources focused on the two cities they had partnered with, Vera asked Data Clinic to investigate what data is currently published openly from other cities across the US and to help consolidate the findings into a standard format to aid in intra- and inter-city analysis. This is the first in a series of blog posts that will describe what we found, as well as the process used to develop a new consolidated dataset as an open resource for the public, researchers, and police departments across the country.
The Problem
The city of New Orleans receives approximately 1200 calls for assistance every day. Each request, which can originate from either a member of the public or a police officer, is logged, dispatched, and monitored through a public safety communications center. In the interest of transparency and reporting, New Orleans — like many other cities — makes anonymized versions of these calls available through their open data portal.
For organizations like Vera, these datasets provide a great resource to enable the systematic study of policing and better inform related policies across the country. However, they also present a challenge: this data is generated and recorded with operations rather than analytics in mind. Within a given city, the categories for recording a particular call type often shift from year to year, and definitions may also change over time.
This prospect becomes even more complicated when we try to bring together data from multiple cities that use different column names and taxonomies for the variables of interest.
Cities With Open 911 Data
The first step in producing a consolidated 911 dataset was to identify which cities had sufficient open data to be useful in an analysis. In particular, Vera is interested in looking at cities with as many of the following characteristics as possible:
- Date and time of the call
- Reason for the call (Call for Action (CFA) or Call for Service (CFS) code)
- If the call was officer-initiated or not
- Outcome of the call (disposition)
- Geographic location of the call
- Response time of the call (how long it took for the police to respond to the request)
Looking at open data portals for cities across the US, we identified the following cities to have all or most of these attributes:

However, among cities with open 911 data, the quantity and quality of what’s available varies widely, as demonstrated in the table above. Furthermore, even when a variable does exist, there is often a large range of categories that makes analysis and comparisons across cities impossible.
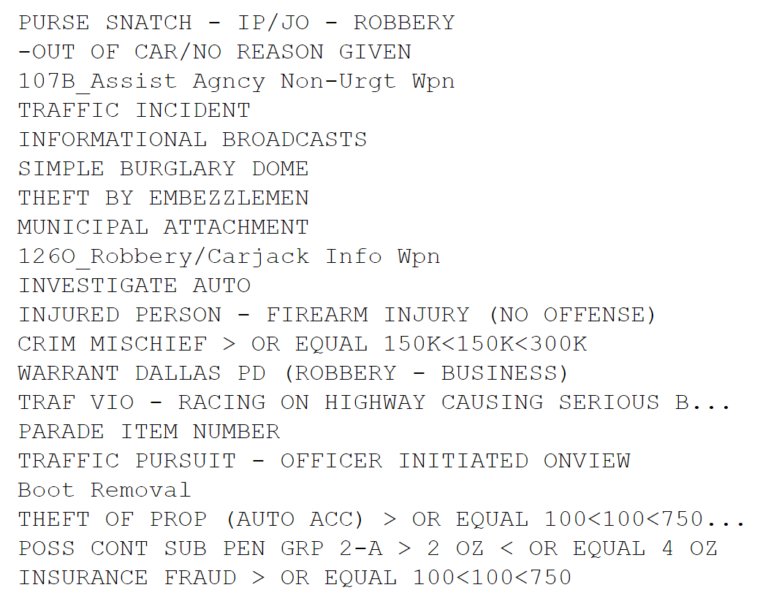
For example, let’s look further into the column indicating the reason for a given call. Merging the five cities together, we end up having over 2,683 different call types listed. To give you an idea, the following list includes a mere fraction of these:

Attempting to perform any analysis on so many categories is nearly impossible. Thus, for our project, this data needed to be cleaned, merged, and consolidated.
The Solution
Having identified the cities we were interested in examining, we turned our effort to creating a pipeline to obtain the data for each of those cities, clean it, standardize column names and taxonomies, merge them, and attach census demographic data to each call. This is a critical and much needed pipeline for advocates, policymakers, journalists, and other stakeholders to more conveniently and easily understand their communities. Moreover, for organizations like Vera, it is a first step in starting to engage in rich data-driven conversations to think critically about the most suitable responses to both reduce the risk of unnecessary enforcement and better resolve the call.
We created this pipeline by developing an extensible Python module that we are in the process of open-sourcing, and that consists of the following steps:
- Download available up-to-date data from a city’s open data portal → This includes call response files along with any geographic information about the beats/patrol areas of the city
- Download demographic data for the city → This includes data from the 2017 American Community Survey 5-Year Survey at the tract level along with the polygons for each tract
- Standardize the names of each column in the dataset
- Consolidate categorical variables to a common taxonomy → For CFA code, Disposition type, and Call Type, map the categories for each city to a common set
- Perform geospatial processing → Determine the census tract of each call request; Aggregate calls to census tracts; Assign census demographic data to each call
To enable the easy addition of future cities to the dataset — or even future years of data from one of the existing cities that might have a different structure or taxonomy — we designed the Python module in an extensible manner. Each city has a configuration file that contains all the information and custom code needed to process that city’s data.
For more details regarding steps 2 and 3, stay tuned for our upcoming deep-dive blog posts on generating common taxonomies and geospatial/temporal processing of the data.
In addition to the data cleaning and merging pipeline, the Python module also includes methods to easily query the resulting dataset and produce standard visualizations for each city, as well as visualizations comparing data across regions.
Questions We Can Ask of the Data
Now, with the data in a consolidated format, we can start to ask interesting questions through targeted queries. For example, does the type of 911 calls change with neighborhood characteristics? Using our dataset, we can quickly produce visualizations that, for example, show the breakdown of call outcomes, the ratio of officer-initiated calls, and predominant call types for census tracts with different income distributions in New Orleans (see graphs below).


From the data, we can see that calls for “suspicious behavior” are lower in high-income neighborhoods, but a higher fraction of these calls tends to be initiated by officers, and more often results in enforcement action being taken.
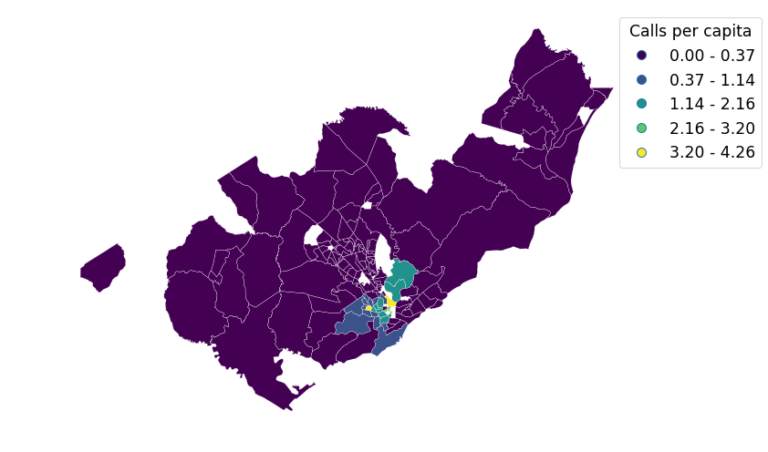
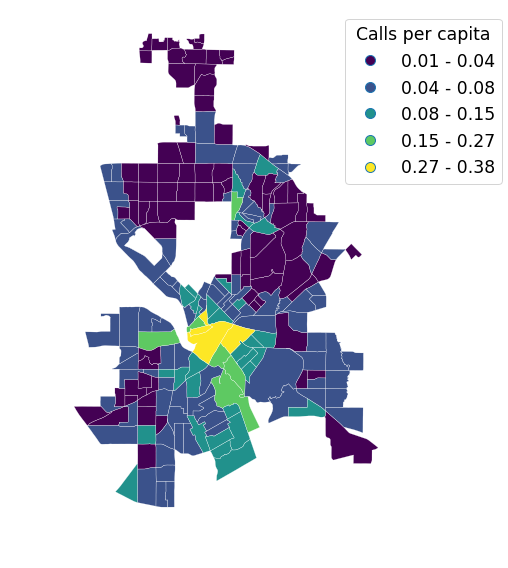
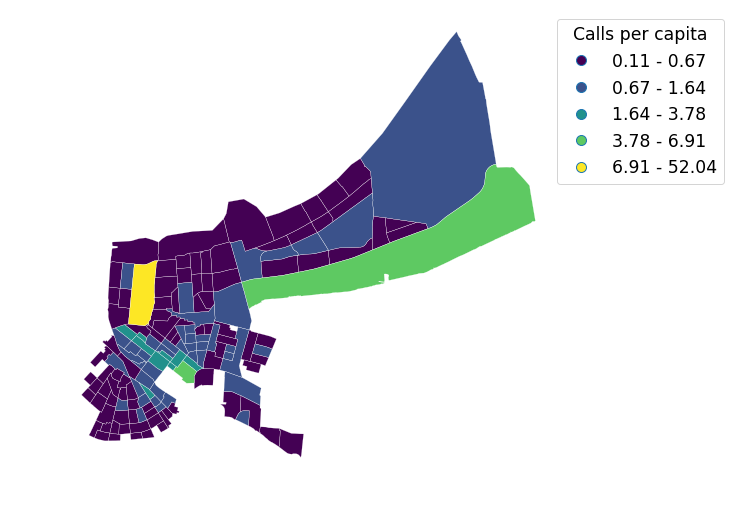
We can also start to map out and visualize individual variables in our datasets to see how they vary across a city. The following maps, for example, show the yearly average call volume per capita for violent crimes for each of our target cities. Note that Seattle is not pictured as the location (latitude and longitude) of 911 call data is not available for that city.


Caveats with Using the Data
As with all datasets, there are important caveats to keep in mind when doing analysis with this one.
First, the demographics associated with each call are drawn from the population of those who live within the census tract that the call originated from. Oftentimes, these may not be the people who are making the calls or about whom the calls are being made, complicating any analysis of the relationships between residential demographics and call characteristics. In general, demographics should be used to understand the place-based context in which the 911 call is occurring rather than referring to the characteristics of individuals initiating a request or the subjects of a call.
Second, although we have worked thoughtfully and collaboratively with Vera researchers in our consolidation of different call reasons, disposition types, and request-initiated-by categories, inconsistencies are possible. For example, our own understanding of these taxonomies is limited and may differ from that of individuals entering them into the 911 system. However, in cases where things might be unclear or incorrectly attributed, each call in the dataset is easily linked back to the raw data to enable further investigation and verification.
Accessing the Data
We have open-sourced the cleaned data for each city along with the scripts we used to generate that data on our GitHub repo. You can download the data directly as a CSV, or if you are interested in contributing to the project, you can open issues and pull requests. We are eager for individuals to contribute other cities’ data to the project or to extend the existing range of variables we have included for each city.
If you have questions, find any inconsistencies with the data, or use it in a project, we would love to hear from you. You can reach out to us at dataclinic@twosigma.com.


